Are you interested in using Power BI to create interactive visualizations of your data collected in SurveyCTO? We’re happy to share our new Support Center guide that presents a few ways that you can automate processes and feed Power BI for up-to-date data visualization dashboards, even while your data collection is ongoing.
While SurveyCTO’s built-in Data Explorer allows you to monitor and visualize your data in real time, it isn’t as diversely featured as a purpose-built system like Power BI. With Power BI, you can connect to hundreds of data sources and create visualizations that you can share, as well as embed in your app or website. If you’re doing longitudinal research or need to visualize data coming in from different forms, using Power BI is especially advantageous.
In this blog post, we present a brief overview of 4 ways that you can connect your data to Power BI, as well as an example of how a SurveyCTO user has done so for a natural disaster response effort. Make sure to explore our multi-part guide for more detailed guidance on setup and how to choose the right option for the needs of your project and organization.
Tracking emergency response with a SurveyCTO-Power BI integration

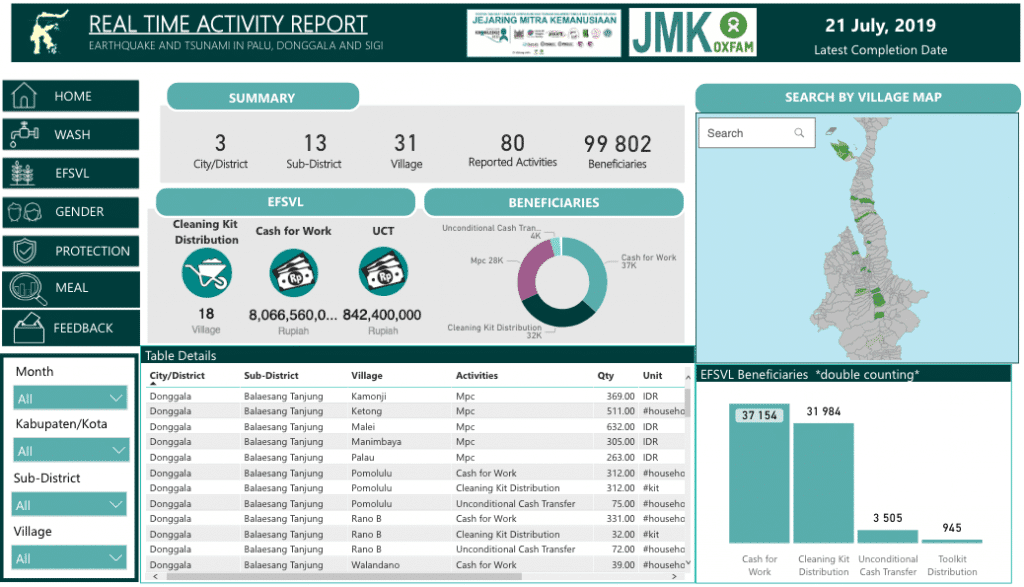
When a massive earthquake and tsunami struck Palu, Indonesia in September 2018, claiming 2,000 lives and affecting nearly 2 million people, Oxfam GB mobilized with local partners to provide essential supplies, build sanitary infrastructure and water distribution systems, and set up cash-for-work programs.
Oxfam GB also used a SurveyCTO-Power BI integration (by developing a proprietary connection using our API) to capture and track real time data on service delivery, beneficiaries, and training, across geography and time. For Oxfam GB staff members, as well as for affected communities, charitable givers, and the global public, the public dashboard, which is viewable online, serves as a means to easily see the results of their vital work.
Integration options
A SurveyCTO-Power BI integration is possible by either using SurveyCTO’s cloud data publishing features or API (you’ll need to log in to view). Our multi-part guide walks you through how to integrate with cloud publishing via Google Sheets and Microsoft Excel and with API requests via R scripts and Microsoft Azure. All the options we present allow you to refresh your Power BI reports and dashboards with incoming data from SurveyCTO just by clicking on the Refresh button in Power BI.
Google Sheets
Publishing data to Google Sheets is probably the easiest way to connect your data from SurveyCTO to Power BI and involves no additional costs. It’s limited to 5 million cells, so it’s not an indefinite solution. Additionally, if you’re working with an encrypted form, you won’t be able to publish to Google Sheets. However, if you’re looking for a simple alternative to monitor or analyze your incoming data with Power BI, then this connection may be the best fit for you.
Microsoft Excel
There are a few ways to get your data from SurveyCTO into Microsoft Excel, and on the other side, Power BI offers several options to import Excel data to create dashboards and reports. In our guide, we focus on the most automated workflow option, which is to first publish SurveyCTO form data to Zapier, send that data to an Excel workbook stored in OneDrive, which will be used as a data source by Power BI.
R Script
R is a popular, free programming language and statistical environment that is simple enough to set up without much experience, and also supports encrypted data. We recommend that you use this integration option if you already use R and are looking to summarize data for presentation in reports or dashboards. We also recommend that you consider R as an integration option if the limitations of Google Sheets or an Excel file as a bridge are too constraining. You’ll find the R method to be quicker and easier than the Excel option described above, even if you’re not familiar with R.
Microsoft Azure
Azure is a cloud database solution in the Microsoft product ecosystem. You should consider it as an option if your organization has long-term data collection projects and many data consumers who need to independently view up-to-date dashboards and reports. Azure can also effectively facilitate long-term storage of vast datasets over time. So while it’s more complex to set up a connection with, it doesn’t have the storage limitations of Google Sheets or Excel, and can fulfill diverse data source requirements beyond Power BI.
In our guide, we’ve only presented some of the ways that you can connect your data to Power BI. If you need any help doing so, submit a support request, and share your experiences setting up integrations in our user forum. You can also learn more about all of our integrations on our website and in our product documentation.

