After a successful pilot of a pandemic simulation using SurveyCTO earlier this year, members of our team had the pleasure of participating in its implementation as part of the Harvard Kennedy School (HKS) module “Fundamentals of Policy Analysis and Decision Making,” a required course for 250 Masters in Public Policy students.
Simulations in class can be high-energy, dramatic affairs. In previous iterations of the pandemic simulation at HKS, students would scramble around the classroom, jumping between conferring as a team, reporting their decisions, and rolling dice to initiate the next stage of the “pandemic.” Meanwhile, teaching assistants would dispense color-coded papers based on dice rolls, tally decisions, and pass scribbled counts on to the professor to keep him or her apprised of the distributions of the decisions.
“…[the online simulation] helped create an environment where more and deeper learning was much more achievable than last year.”
There’s no question that this approach to simulations is exciting and fun. But it often leaves very little in-class time for discussions around the decision-making process and subsequent outcomes. It may also favor a less deliberative style of decision-making as students get carried away in the energy of the moment.
In digitizing the simulation and requiring students to complete the simulation before class, Professor Dan Levy was now able to devote the bulk of class time to processing the simulation and the issues that surfaced. “We accomplished three things that were key to advance learning,” Professor Levy reported.
“First, we created more time in class for deeper discussion of the key ideas the simulation was meant to illustrate. Second, students had more time to reflect on their decisions, and, third, we were able to walk into the class with so much more information about what the students had done during the simulation. This allowed us to call on specific students who had either chosen a particularly interesting path or who justified their actions in a way that would be likely to lead to a good discussion in the classroom. Ultimately, all these things helped create an environment where more and deeper learning was much more achievable than last year.”
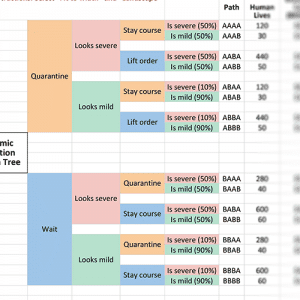
 The opportunity for a deeper discussion was due in no small part to research fellow Michael Fryar, who took advantage of SurveyCTO’s integration with Google Sheets to create a dashboard that processed responses as they streamed in. “My favorite feature of the dashboard was the way it could be a resource for teachers just wanting a quick summary of the quantitative data as well as for teachers wanting to delve into the richness of the qualitative data gathered by SurveyCTO,” Fryar said. For example, Professor Levy and the other instructors were able to view a dynamic version of the paper decision tree (see image) that tallied student decisions and was letter- and color-coded by decision. They could also easily query the response data to cold-call students about how they felt about their experience or the decision they made.
All in all, it was rewarding to see how SurveyCTO could be used to support pedagogical goals in the classroom. Instead of a class period focused on the logistics of running a simulation, instructors could meaningfully explore the learning goals at hand: how decision analysis can be deployed under real-world uncertainty, the distinction between good and bad outcomes versus good and bad decision processes, and how better decision processes can lead to better outcomes more of the time (but not all of the time).
Want to learn more? Read Chris’ behind-the-scenes look at how to build an online simulation using SurveyCTO.

